

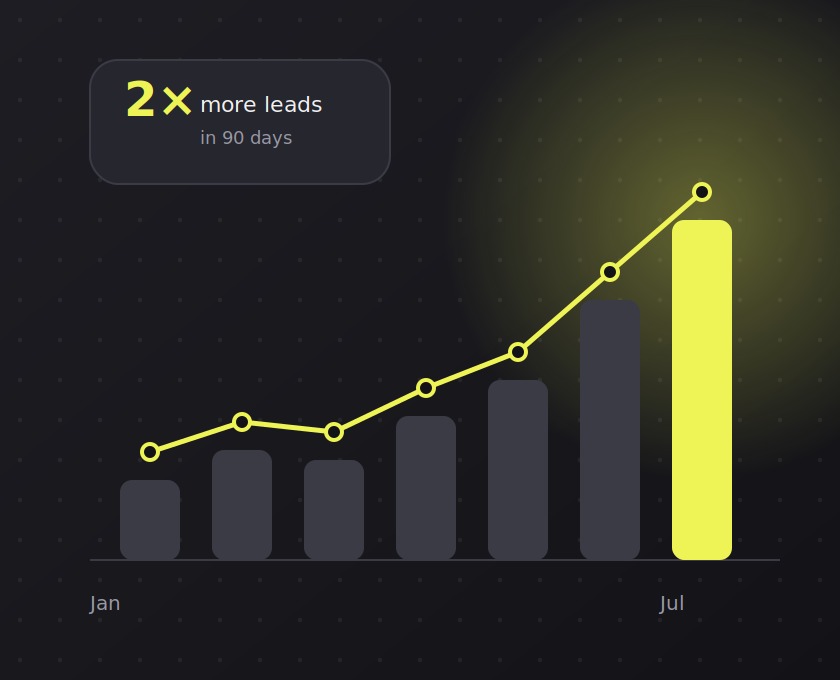
Most dashboards are built as a record of what the database contains, not as an answer to a question somebody has. That mismatch is why so many are opened once a month.
Start from the decision, not the data
Before choosing charts, write down the decision the dashboard is supposed to support. If the answer is "do we need to intervene today", the view needs a small number of exceptions, not a grid of trends.
A useful test: if every number on the screen changed slightly and nobody would act differently, the screen has too much on it.
Density is a real constraint
Analysts often want everything visible. Users want to find one thing. The compromise that works in practice is a scannable summary with progressive disclosure -- headline figures and exceptions up front, detail one click away.
Resist the temptation to add a global filter panel. Every filter is a decision, and most viewers will not touch any of them. Prefer sensible defaults and a small number of deliberate views.
Make the comparison automatic
Raw numbers rarely answer a question on their own. Showing a change against the previous period or against target costs little and removes the mental arithmetic that stops people trusting what they are looking at.
Finally: be explicit about freshness. A timestamp that reads "updated 6 minutes ago" tells the viewer how much to trust the number, and it is the cheapest trust signal available.
 Search
Leave a comment